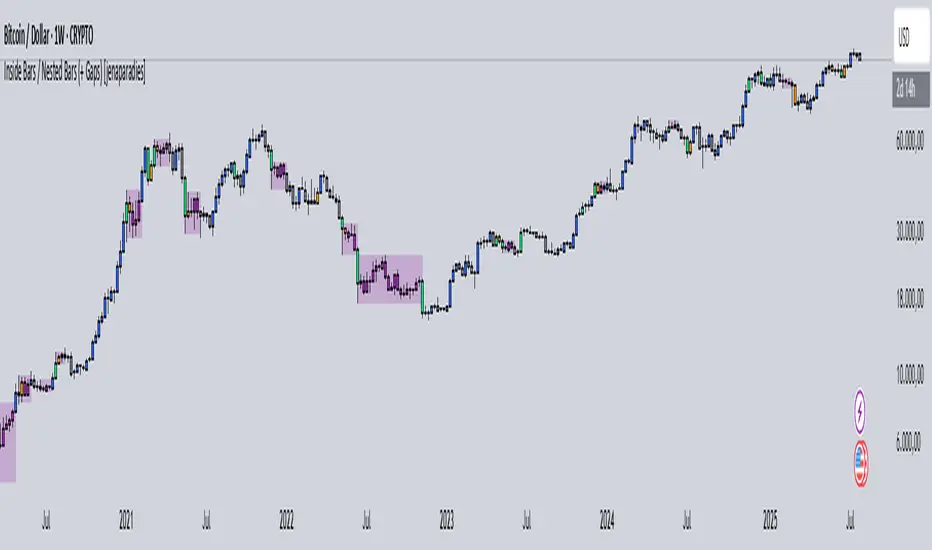
Inside Bars / Nested Bars (+ Gaps) [jenaparadies]📌 Features
Highlight inside bars
Highlight bars that remain within the range of a mother bar (called nested bars )
Highlight the mother bar (optional)
Highlight consecutive nested bars using a visual box (optional)
Enable no-gap candle logic (optional, see below)
Show no-gap candles on the chart (optional)
Fully customizable colors and appearance
📌 Method
An inside bar is any candle whose high is lower than or equal to the previous candle's high, and whose low is higher than or equal to the previous candle's low. In other words, the entire price action of the inside bar remains within the range of the previous candle without exceeding it. The preceding candle is referred to as the mother bar .
Occasionally, the candle following the inside bar may break above or below the inside bar's range, while still remaining fully within the high and low of the mother bar. These candles are referred to as nested bars and are highlighted in a different color.
Optionally, sequences of consecutive nested bars can be enclosed within a box to emphasize consolidation zones.
📌 No-Gap Candles (Optional)
This feature adjusts each candle’s opening price so that it matches the closing price of the previous candle. It is particularly useful for assets that frequently experience large gaps between candles.
By extending each candle's effective range to include the previous candle's close, the indicator maintains structural consistency over timeframes, especially when the open price deviates significantly from the prior close. Inside bars are then identified relative to the extended range of the mother bar.
Optionally, the adjusted no-gap candles can be visualized directly on the chart for better clarity.
🎁 Bonus
Activating the "Show No-Gap Candles" option transforms any line chart into a gap-free bar chart ‒ ideal for visualizing economic data such as inflation rates.
在腳本中搜尋"inside bar"
INSIDE BAR This indicator identifies Inside Bar.
Inside Bar is an indecisive setup where traders are not sure of the direction which is reflected in the bar range which is usually narrower.
The day following Inside Bar usually would be a decisive bar with wide range.
This decisive bar can be exploited if traded with discipline.
The steps to follow are :
At EOD :
1) Use daily charts for locating Inside Bar with this indicator on.
2) Ensure you keep the parameter prev range Vs inside bar as 0.25 irrespective of default value. This means that the previous bar range is greater than the inside bar range by 25%.
3) Try going through all FNO scrips to locate inside bar (as there is no scanner in Trading View).
4) Once an Inside Bar scrip is located, earmark them or send them to watchlist.
5) Now you will have a watchlist with around 5-6 scrips.
Next trading day at market opening:
5) When the market opens, wait till 9.45 am (first half an hour).
6) Mark the first half an hour high and low. These are opening range high and opening range low.
7) If price breaks out decisively on the upside above opening range high, buy with a stop of opening range low. Target can be based on super trend or ema or any other method. If price breaks out decisively on the downside below opening range low, short with a stop of opening range high.
8) Ensure you follow disciplined position sizing.
Good luck.

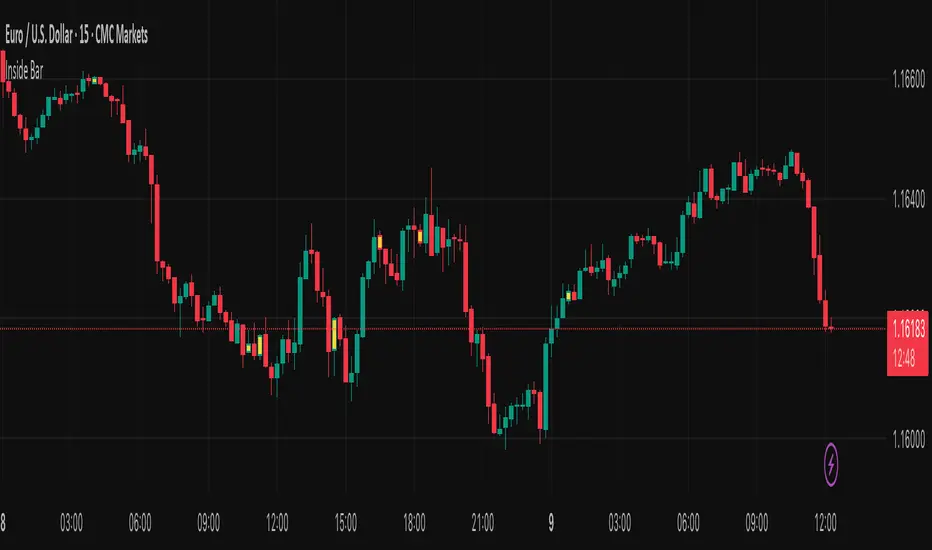
Inside Bar Detector - 15min
🔍 What is an Inside Bar?
An **Inside Bar** is a candle that forms **entirely within the high and low of the previous candle**. It represents **consolidation**, **indecision**, or **potential reversal**, and is a key signal in The Strat trading method.
🔧 What the Script Does:
1. **Timeframe Restriction**:
* The script activates **only on the 15-minute timeframe**, avoiding clutter on other timeframes.
2. **Inside Bar Logic**:
* It checks whether the **current bar’s high is lower than the previous bar’s high**, **AND** the **current bar’s low is higher than the previous bar’s low**.
* If both conditions are true, it confirms an Inside Bar.
3. **Visual Display**:
* When an Inside Bar is detected, the script **plots a yellow label ("1") above the bar**.
* The label represents the Strat 1-bar and helps you easily spot potential setups.
🎯 Use Case:
* Ideal for **Strat traders**, **price action analysts**, or **any trader** looking for breakout or reversal opportunities.
* Common setups include **1-2**, **1-3**, or **double inside bar** breakouts.

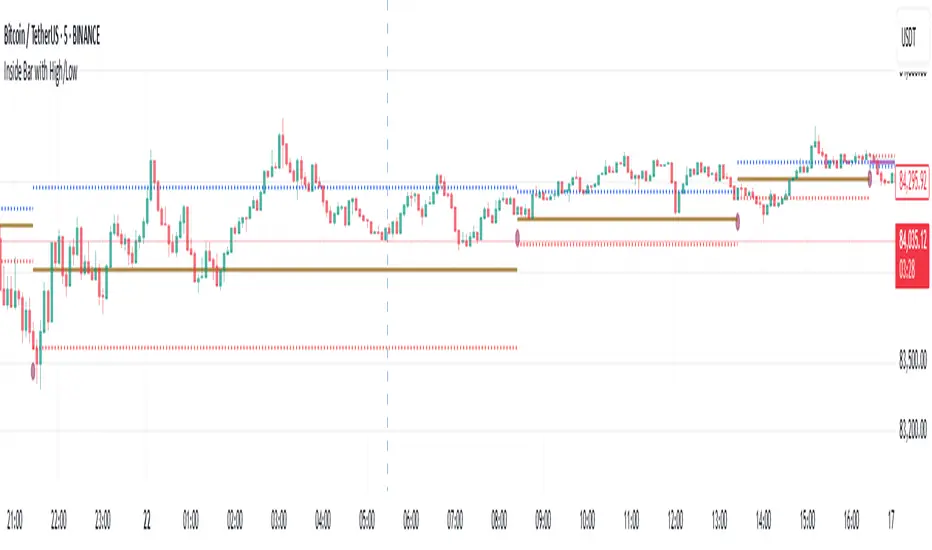
Inside Bar with High/LowInside Bar with High/Low
The indicator plots horizontal mid line between two Inside bars with High / Low with Multi Time Frame Selection by the user which can be traded in trending markets in the direction of the trend, when traded this way they are typically referred to as a ‘Breakout Play’ or an inside bar ‘Price Action Breakout Pattern’ They can also be traded counter-trend, typically from ‘Key Chart Levels’ , when traded this way they are often referred to as ‘Inside Bar Reversals’ .
The classic entry for an inside bar signal is to place a buy stop or sell stop at the high or low of the mother bar, and then when price breakouts above or below the mother bar, your entry order is filled with best time frame preferably more than 1 hour.
Stop loss placement is typically at the opposite end of the mother bar, or it can be placed near the mother bar halfway point (50% level), typically if the mother bar is larger than average.
It’s worth noting that these are the ‘classic’ or standard entry and stop loss placements for an inside bar setup is a useful tool for traders looking to identify potential reversals using the 20/50 EMA and candlestick patterns. However, like any trading tool, it should be used in conjunction with other indicators and analysis techniques for better accuracy
And also this tool is especially useful for day traders who want to track price action during specific times of the day and make informed decisions based on market behavior with more than 60 minutes period
As always, back testing and customization are recommended to optimize performance across different market conditions
In the end, experienced traders may decide on other entries or stop loss placements as they see fit.
Please remember that this indicator is provided for educational purposes only and does not constitute financial advice
Inside Bar ExplosionCategory: Price Action, Volatility Compression, Breakout Detection
🔍 Overview
This indicator detects multi-bar inside candle compressions (“inside bar coils”) and marks powerful breakout moments that follow.
It highlights when volatility contracts inside a large “mother candle” and then suddenly explodes with a bullish or bearish breakout backed by volume confirmation.
⚙️ How It Works
Mother Candle:
Detected when a large candle (range > defined %) appears with above-average volume.
Compression Phase:
Consecutive candles stay completely within the range of that mother candle.
The longer the compression, the tighter the coiling pattern.
Explosion Candle:
A candle breaks above or below the compression range,
Has a large range and a volume spike, confirming breakout direction.
💡 Visual Cues
🟨 Yellow Highlight: Mother Candle
🔵 Blue Zone: Compression (Inside Bar Cluster)
🟢 Green Background: Bullish Explosion
🔴 Red Background: Bearish Explosion
🚀 Label: Bull breakout with days in compression
💥 Label: Bear breakdown with days in compression
⚡ START: Marks final compression candle before breakout
📊 Table (Top Right): Live compression stats (days, range %, volume ratio)
🧠 Parameters
Setting Description
Minimum Inside Bars Minimum candles inside the mother candle to qualify as compression.
Maximum Inside Bars Limit to prevent invalid long compressions.
Mother Candle Min Size (%) Defines how large a candle must be to be considered a mother candle.
Explosion Candle Min Size (%) Minimum % range for valid breakout candles.
Volume Spike Multiplier Required volume increase vs. average for breakout validation.
Show Labels / Box Toggle visual elements on/off for clarity.
🚨 Alerts
⚡ Compression Start: New coiling phase detected.
🚀 Bull Explosion: Bullish breakout with volume confirmation.
💥 Bear Explosion: Bearish breakdown with volume confirmation.
📈 Use Cases
Identify volatility squeezes before major breakouts.
Detect range-bound periods leading to trend initiation.
Combine with moving averages or RSI for higher confidence setups.
⚠️ Notes
Works best on daily or 4-hour charts.
Works for stocks, crypto, forex, or indices.
Does not repaint — signals are confirmed on bar close.

Inside Bar Highlighter by nkChartsOverview:
The Inside Candle Highlighter is a simple yet powerful TradingView indicator designed to identify inside bars (inside candles) on your chart. An inside candle is defined as a candle whose high is lower than the previous candle's high and low is higher than the previous candle's low, meaning it forms entirely within the range of the preceding candle.
Inside candles are commonly interpreted by traders as periods of market consolidation or indecision and often precede breakouts or significant price moves. This indicator highlights these candles directly on your chart, making them easy to spot at a glance.
Features
Detects Inside Candles: Automatically identifies bars that are fully contained within the previous bar’s high-low range.
Confirmed Bar Coloring: Colors the candle after it closes, ensuring no repainting occurs during formation.
Style Tab Customization: Users can adjust the candle color directly from the Style tab, allowing seamless integration with your chart theme.
Clean & Minimal: Only inside candles are highlighted, keeping charts uncluttered.
How Traders Can Use It
Identify Consolidation Zones: Quickly spot periods where the market is contracting.
Prepare for Breakouts: Inside candles often signal an upcoming directional move; traders can plan entry or exit points based on breakouts from the inside candle range.
Combine With Other Indicators: Use alongside trend indicators, volume tools, or support/resistance levels to enhance trade confirmation.
Recommended Use
Works on all timeframes — from intraday charts to daily or weekly charts.
Particularly useful in price action trading, swing trading, and trend-following strategies.
Ideal for traders who want a visual cue for consolidation and potential breakout areas without adding complexity to the chart.
Note: This indicator only highlights inside candles. Interpretation and trading decisions are left to the user.
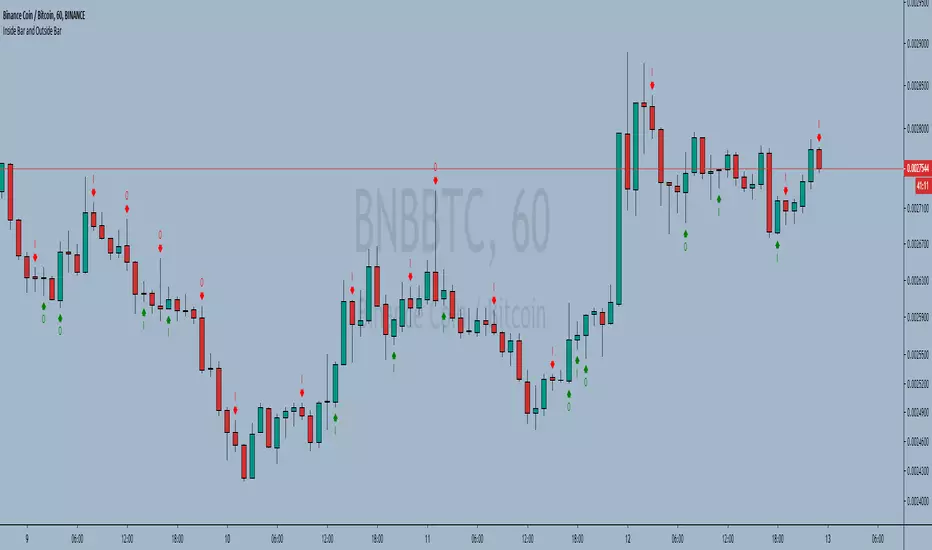
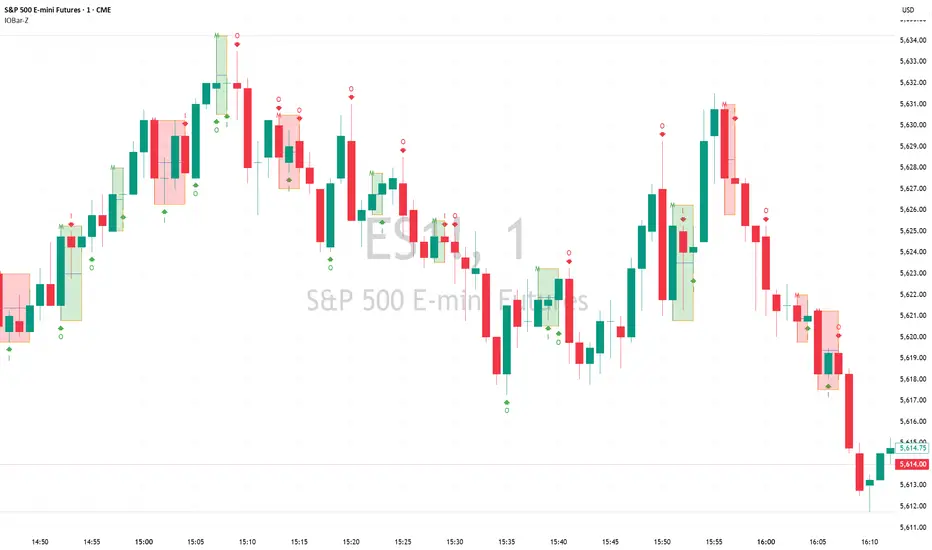
Inside Bar and Outside Bar Simple indicator, to show outside bars and inside bars
inside sellbar = "I" in red color
inside buybar = "I" in green color
Outside sellbar = "O" in red color
Outside buybar = "O" in green color
----------//---------------
PT-BR
Indicador simples, para mostrar outside bars e inside bars
inside sellbar = "I" na cor vermelha
inside buybar = "I" na cor verde
Outside sellbar = "O" na cor vermelha
Outside buybar = "O" na cor verde
Inside Bar Breakout/Fakeout with AI Scenarios [Yosiet]Inside Bar Breakout/Fakeout Indicator with Scenarios
The Indicator is a powerful tool for traders looking to identify potential breakout and fakeout opportunities based on inside bar patterns. This indicator combines multiple technical analysis concepts to provide a comprehensive view of market behavior, helping traders make more informed decisions.
Key Features
Inside bar detection with filtering
Breakout and fakeout identification
Three distinct scenario detections
Customizable moving average calculations
Flexible visualization options
Alert conditions for various events
How It Works
The indicator identifies inside bars and filters them based on a maximum number of consecutive inside bars. It then detects breakouts and fakeouts using user-defined parameters. The script also calculates moving averages to determine trend direction.
Three specific scenarios are detected:
Strong breakout followed by a strong reversal
Weak breakout with multiple doji/weak candles
Strong breakout without reversal
These scenarios are visually represented on the chart, allowing traders to quickly identify potential trading opportunities.
How to Use
Apply the indicator to your chart
Adjust the input parameters to suit your trading style
Look for inside bar patterns and subsequent breakouts/fakeouts
Pay attention to the three scenario markers for additional context
Use the alert conditions to stay informed of potential opportunities

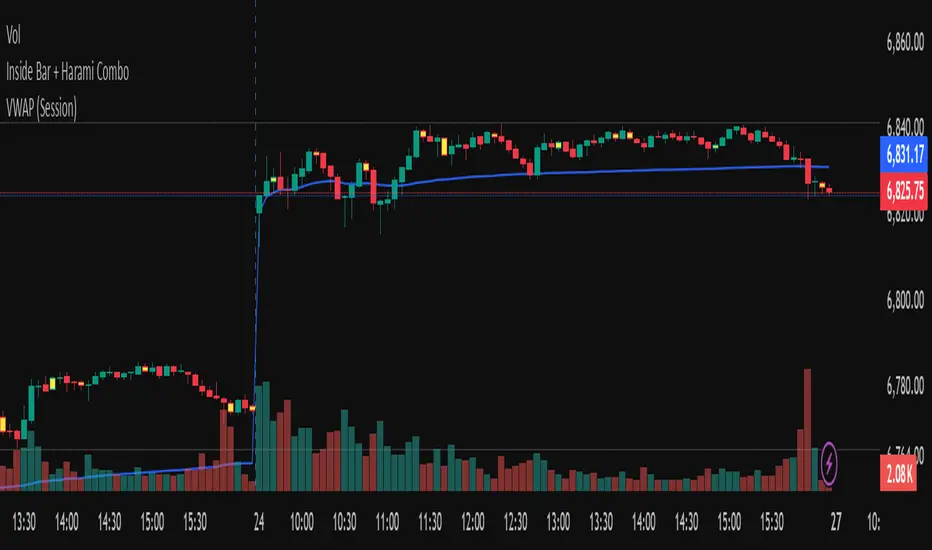
Inside Bar + Harami ComboThis indicator visually highlights Inside Bars, Outside Bars, and Harami candlestick patterns directly on your chart using clean color-coded candles — no labels, no shapes, just visual clarity.
It helps traders quickly identify potential reversal and continuation setups by coloring candles according to the detected pattern type.
🔍 Patterns Detected
🟨 Inside Bar — Current candle’s range is completely inside the previous candle’s range.
Often signals price contraction before a breakout.
💗 Outside Bar — Current candle’s high and low exceed the previous candle’s range.
Indicates volatility expansion and possible trend continuation.
🟩 Bullish Harami — A small bullish candle within the body of a prior bearish candle.
Suggests potential reversal to the upside.
🟥 Bearish Harami — A small bearish candle within the body of a prior bullish candle.
Suggests potential reversal to the downside.
⚙️ Features
Customizable colors for each pattern type.
Simple overlay visualization — no shapes, no labels, just colored candles.
Harami colors automatically override Inside/Outside colors when both occur on the same bar.
Lightweight logic for smooth performance on any timeframe or symbol.
💡 How to Use
Apply the indicator to your chart.
Configure colors in the settings panel if desired.
Watch for highlighted candles:
Inside Bars often precede breakouts.
Harami patterns can mark reversal zones.
Combine with trend tools (like moving averages) to confirm setups.
⚠️ Note
This indicator is for visual pattern detection and educational use only.
Always combine candlestick signals with broader technical or market context before trading decisions.
Inside Bar/Outside Bar/Mother Bar Box By SmartTrader888This Indicator shows:
1. Inside Bar
2. Outside Bar
3. Mother Bar box (Box the mother bar and all subsequent inside bars)
This indicator handles correctly the edge conditions such as:
1. bar close = bar open
2. current bar low equals to mother bar low or current bar high equals mother bar high
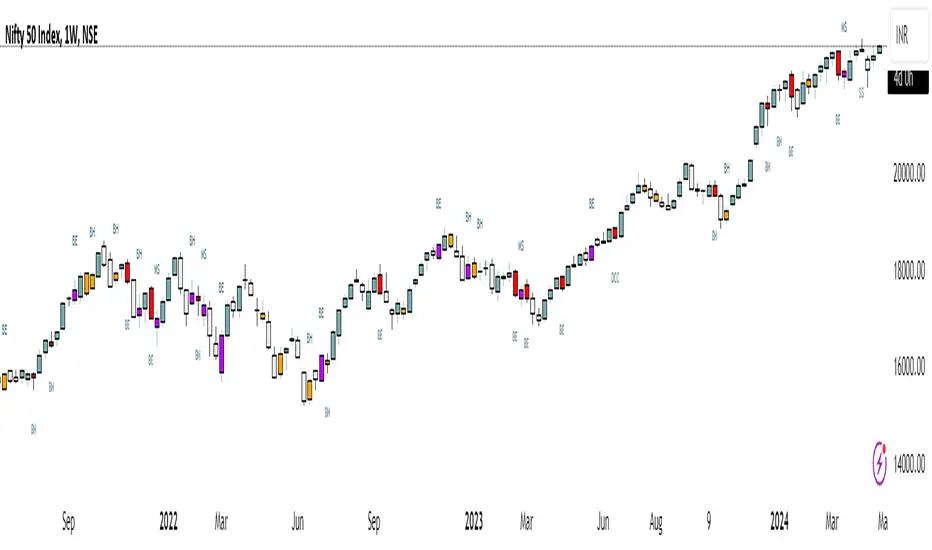
Inside Bar + Bullish and Bearish candlestick [Tarun]
Inside Bar Detection:
The function isInsideBar() checks if a bar is an inside bar, meaning its high is lower than the previous bar's high and its low is higher than the previous bar's low.
Inside bars are highlighted with an orange color.
Bearish Candlestick Patterns:
Bearish Engulfing: When the current candlestick's body completely engulfs the previous candlestick's body.
Dark Cloud Cover: When a bullish candle is followed by a bearish candle that opens above the previous bullish candle's close but closes below its midpoint.
Bearish Harami: When a small bullish candlestick is engulfed by a larger bearish candlestick.
Evening Star: A three-candle pattern consisting of a large bullish candle, a small-bodied candle with a gap up or down, and a large bearish candle that closes below the midpoint of the first candle.
Shooting Star: A single candlestick pattern with a small real body near the bottom of the price range and a long upper shadow.
Bearish Marubozu: A candlestick with a long bearish body and little to no upper or lower shadows.
Bearish candlestick patterns are highlighted with a red color and labeled with abbreviated names.
Bullish Candlestick Patterns:
Bullish Engulfing: Opposite of bearish engulfing, where the current candlestick's body completely engulfs the previous candlestick's body.
Piercing Pattern: When a bearish candle is followed by a bullish candle that opens below the previous bearish candle's low but closes above its midpoint.
Bullish Harami: Similar to bearish harami but bullish, where a small bearish candlestick is engulfed by a larger bullish candlestick.
Morning Star: A three-candle pattern opposite to the evening star, signaling a potential reversal from downtrend to uptrend.
Bullish Hammer: A single candlestick pattern with a small real body near the top of the price range and a long lower shadow.
Bullish Marubozu: A candlestick with a long bullish body and little to no upper or lower shadows.
Bullish candlestick patterns are highlighted with a purple color and labeled with abbreviated names.
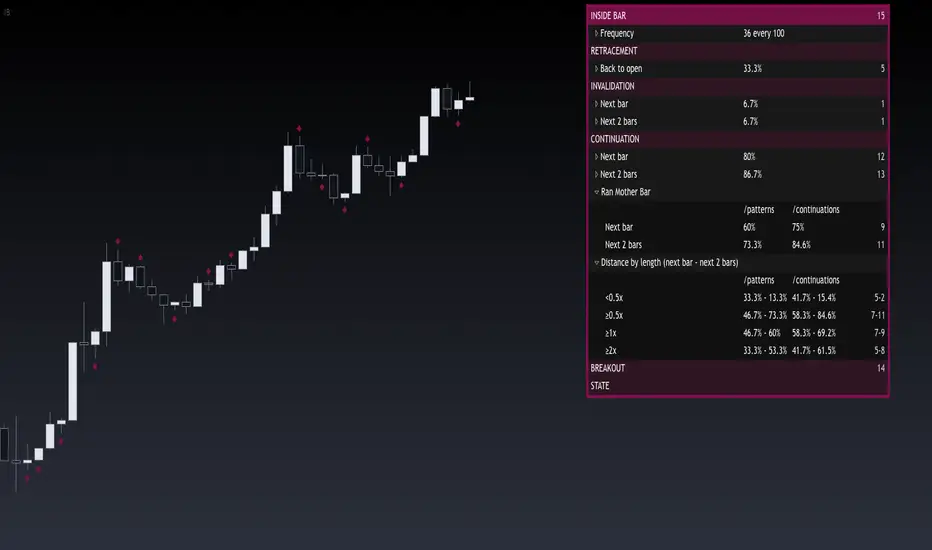
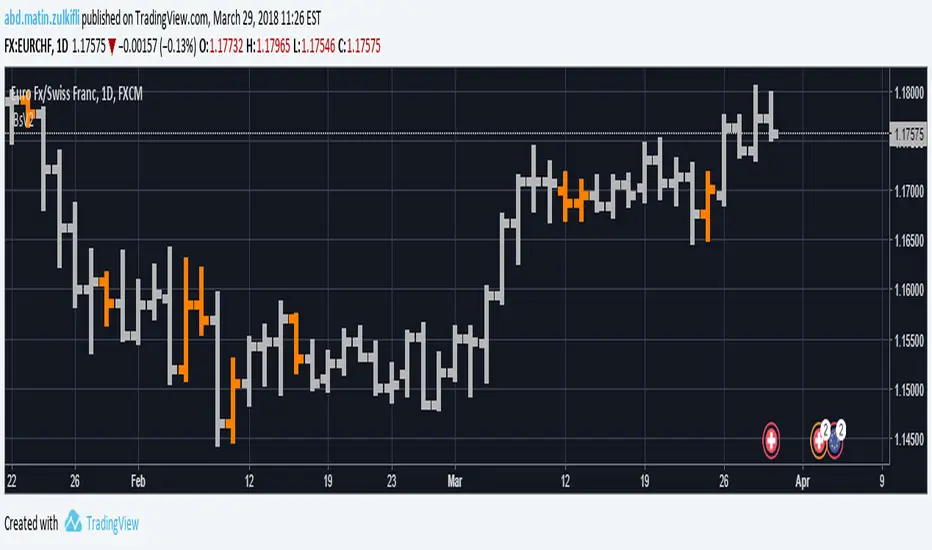
Inside Bar FailureThis indicator provides a statistical report on the Inside Bar Failure candlestick pattern popularized by Trader Dante. Based on the chart's bars, it can improve your edge on any markets and timeframes.
The Inside Bar Failure pattern refers to an Inside Bar breakout that failed to sustain momemtum and closed back within it.
The report is broken down into the different following sections: retracement , invalidation , continuation and breakout .
Each of them provides hindsights about the pattern price behavior and brings answers to questions such as: How often does price retrace? Does the pattern often invalidate? If it doesn't then does it break in the pattern's direction? How far does price go? What are the odds of a false breakout?
While there are many ways to make use of the metrics, my favorite use case is for developing directional and daily/weekly biases while refining my stop/entry/target positioning.
Miscellaneous
Highlights patterns on the chart;
Supports bar to bar analysis and replay functionalities;
Provides counts on the `Data Window` panel for debugging or computing your own metrics;
Settings
Show/hide for toggling different sections;
Report coloring and offset on the x axis;
Gaining Access
This is a private indicator and is available only for my Patrons. You can reach my Patreon page below from the link in my signature.

Inside Bars📌 Overview:
This indicator scans for multiple inside bars during periods of consolidation by dynamically designating a “mother bar” and then marking subsequent bars that trade entirely within its range. It includes an optional doji filter on the most recent candle, helping to confirm indecision before potential breakouts.
🛠 Key Features:
✅ Dynamic Mother Bar Identification:
The script selects a mother bar when the current bar’s range exceeds that of the previous bar. This bar sets the high and low boundaries, creating a reference zone for later price action.
Once a mother bar is defined, subsequent candles that remain completely within its high and low are flagged as inside bars.
✅ Optional Doji Check:
For added precision, an optional feature lets you verify that the most recent bar is a doji—a candle where the difference between the open and close is minimal relative to its total range. This additional filter highlights periods of market indecision, which can often precede strong directional moves.
⚡ Add this script to your chart and enhance your trading strategy! 🚀
Inside Bar AlertThis software finds inside bars even when the inside bar maybe not exactly inside the previous bar. It can also find inside range or smaller range then norm candles. By being able to identify the consolidation bar, it allows you to get on-board just before a likely expansion bars will happen.

Inside BarThis indicator provides a statistical report on the Inside Bar candlestick pattern. Based on the chart's bars, it can improve your edge on any markets and timeframes.
The Inside Bar pattern refers to a candle that makes a lower high and a higher low.
The report is broken down into the different following sections: retracement , invalidation , continuation and breakout .
Each of them provides hindsights about the pattern price behavior and brings answers to questions such as: How often does price retrace? Does the pattern often invalidate? If it doesn't then does it break in the pattern's direction? How far does price go? What are the odds of a false breakout?
While there are many ways to make use of the metrics, my favorite use case is for developing directional and daily/weekly biases while refining my stop/entry/target positioning.
Miscellaneous
Highlights patterns on the chart;
Supports bar to bar analysis and replay functionalities;
Provides counts on the `Data Window` panel for debugging or computing your own metrics;
Settings
Show/hide for toggling different sections;
Report coloring and offset on the x axis;
Gaining Access
This is a private indicator and is available only for my Patrons. You can reach my Patreon page below from the link in my signature.
Inside Bar v2my second attempt in making inside bar indicator only change the color of the inside bar after the bar close (only truly change when new bar is formed) sigh.... i am not a coder anyway.
3 Consecutive Inside Bars - RSTInside bars are often used to identify potential consolidation periods or breakout setups.
This will provide tight range for 3 consecutive inside bars.
Remember that inside bar patterns are just one tool, and no indicator is perfect. Always use sound risk management.

Inside Bar Breakout Alert - RajThis indicator is based on the inside bar strategy it help you to cut down your screen time by giving you constant alerts when a inside bar forms while also gives you alert on bullish and bearish break out of the mother candle.

Inside Bar Visualizer PineV4I didn't find a study for Inside bar as I wanted. Therefore I wrote a one with PineV4. This may help you to see inside bars.
It can recalculate and works with either (opens-closes) or (highs-lows)
Cheers! :)

Inside Bar Alert I need help!!! I created the alert but it triggering during the formation not once it has printed. Does anyone know who to make it trigger the alert once the inside bar is complete and make it plot an arrow when the inside bar has formed?

Inside BarColor codes inside bars/candles on the chart. Either the bar can be coloured and/or a dot appears above the bar

Fakey pattern (Inside Bar False Breakout)Inside Bar + False-Breakout = Fakey pattern
A Fakey pattern can have a pin bar as the false-break bar or not. Fakey’s are a very important and potent price action trading strategy because they can help us identify stop-hunting and provide us with a very good clue as to what price might do next.

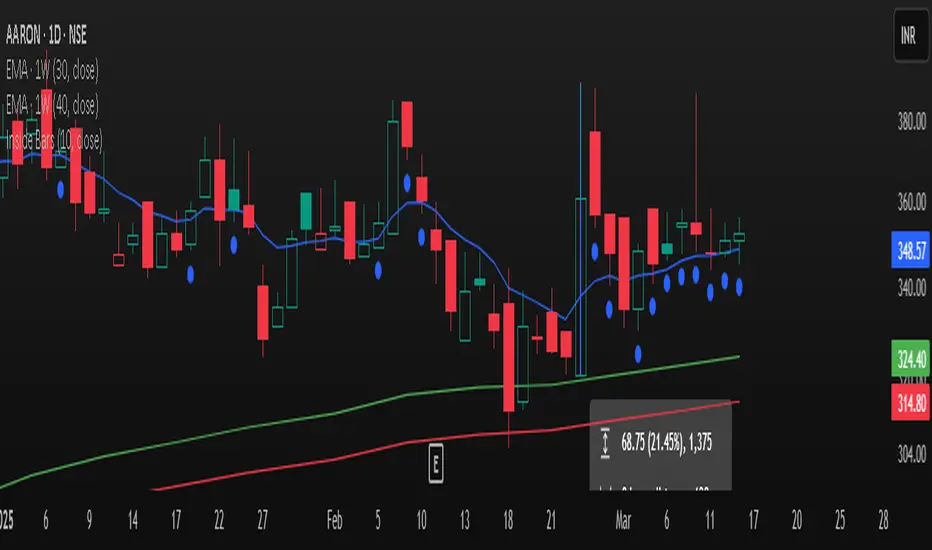
Inside Bar + Volume + MAs + RVol + Volume MilestonesDisplays :
Inside bar near 10 MA
Power volume
MA's
RVOL
HVQ/Y/E
Plots line on Tight Bar closing within 1.5%
RS movement compared to BM & Self
